Research Highlights
Granular data analyses revealing what aggregated reports hide
Transmission
R$ 1,77B
congestion/year
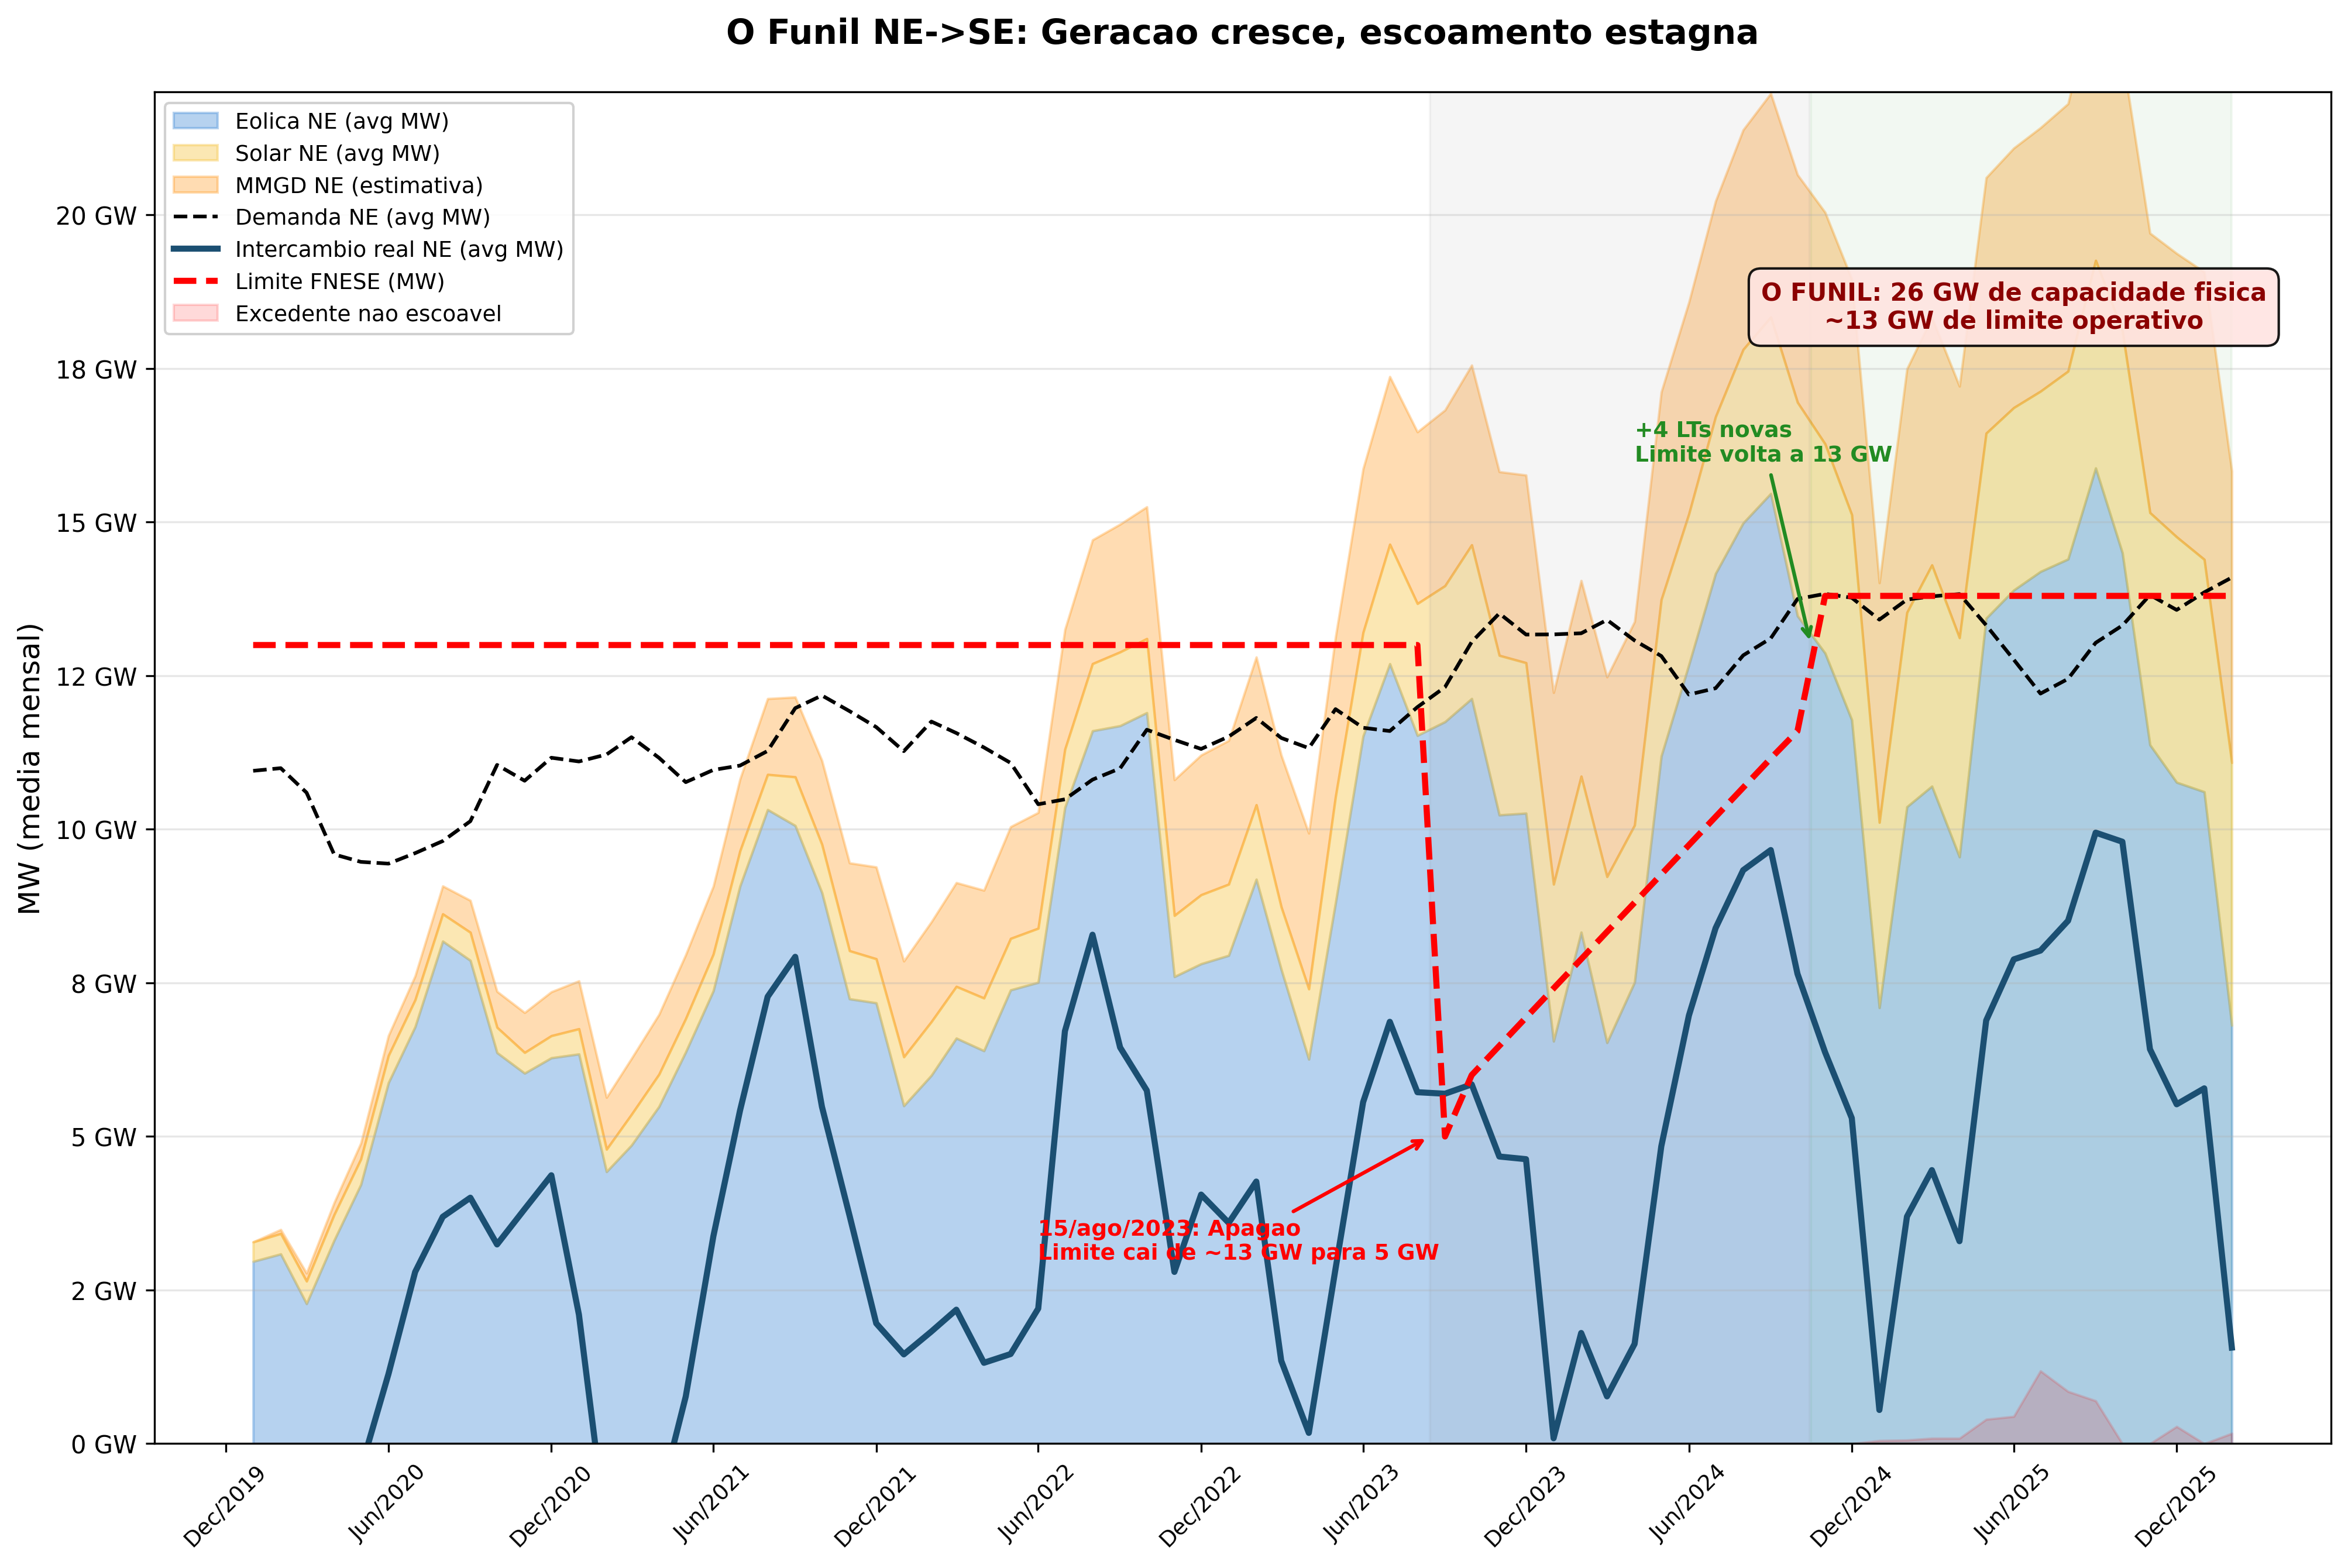
The NE-SE Funnel and the Cost of Congestion
11 lines at 500 kV, 26 GW nominal, R$ 1.77 billion/year in invisible congestion
Technical
87%
unplanned curtailment
The Blind Model Cascade
NEWAVE-DECOMP-DESSEM-PDP: zero curtailment modeled across the entire chain. 87% is a surprise.
Technical
27x
daily floor (P10) increase
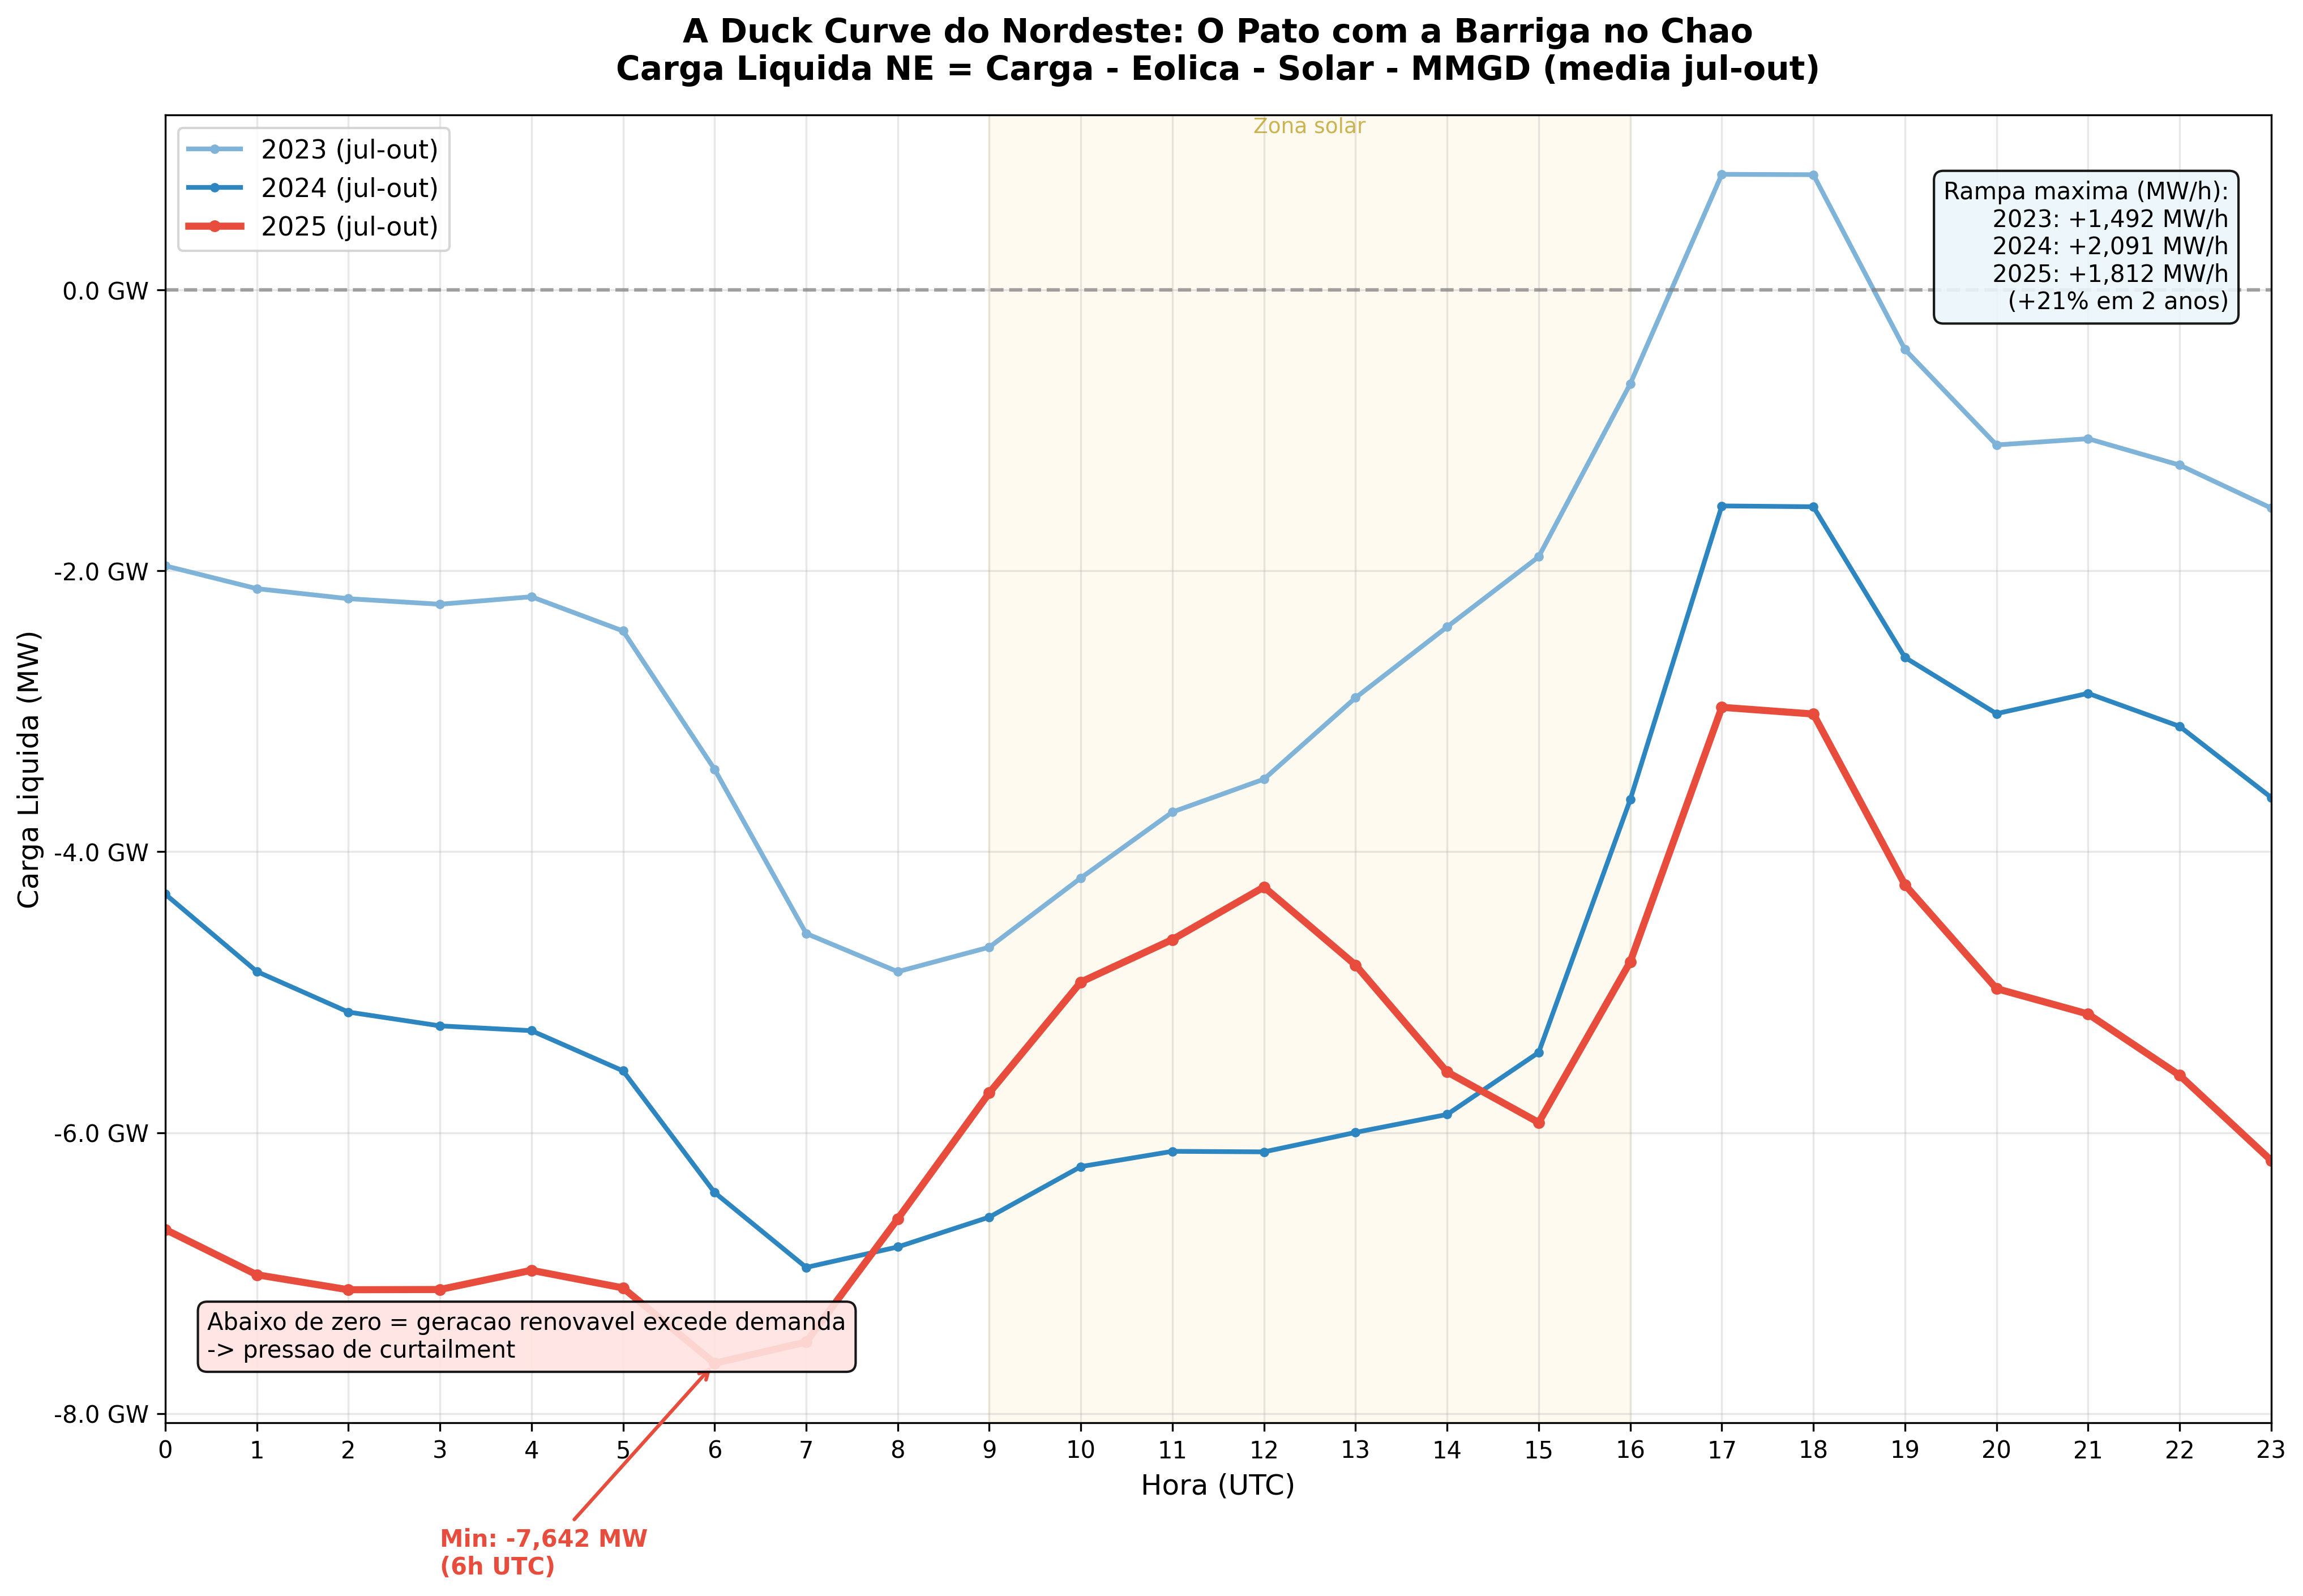
From Duck Curve to Baseload: Waste 24 Hours a Day
P10 jumped 27x. 41% of days with curtailment across all 24 hours. It's no longer a peak phenomenon.
Regulatory
R$ 3,8-4,1B
non-compensable
CNF or ENE? The Clock Decides Compensation
The ONS temporal heuristic that determines whether your curtailment will be compensated. R$ 3.8-4.1B at stake.
Transmission
R$ 115M
cost of 1 equipment offline
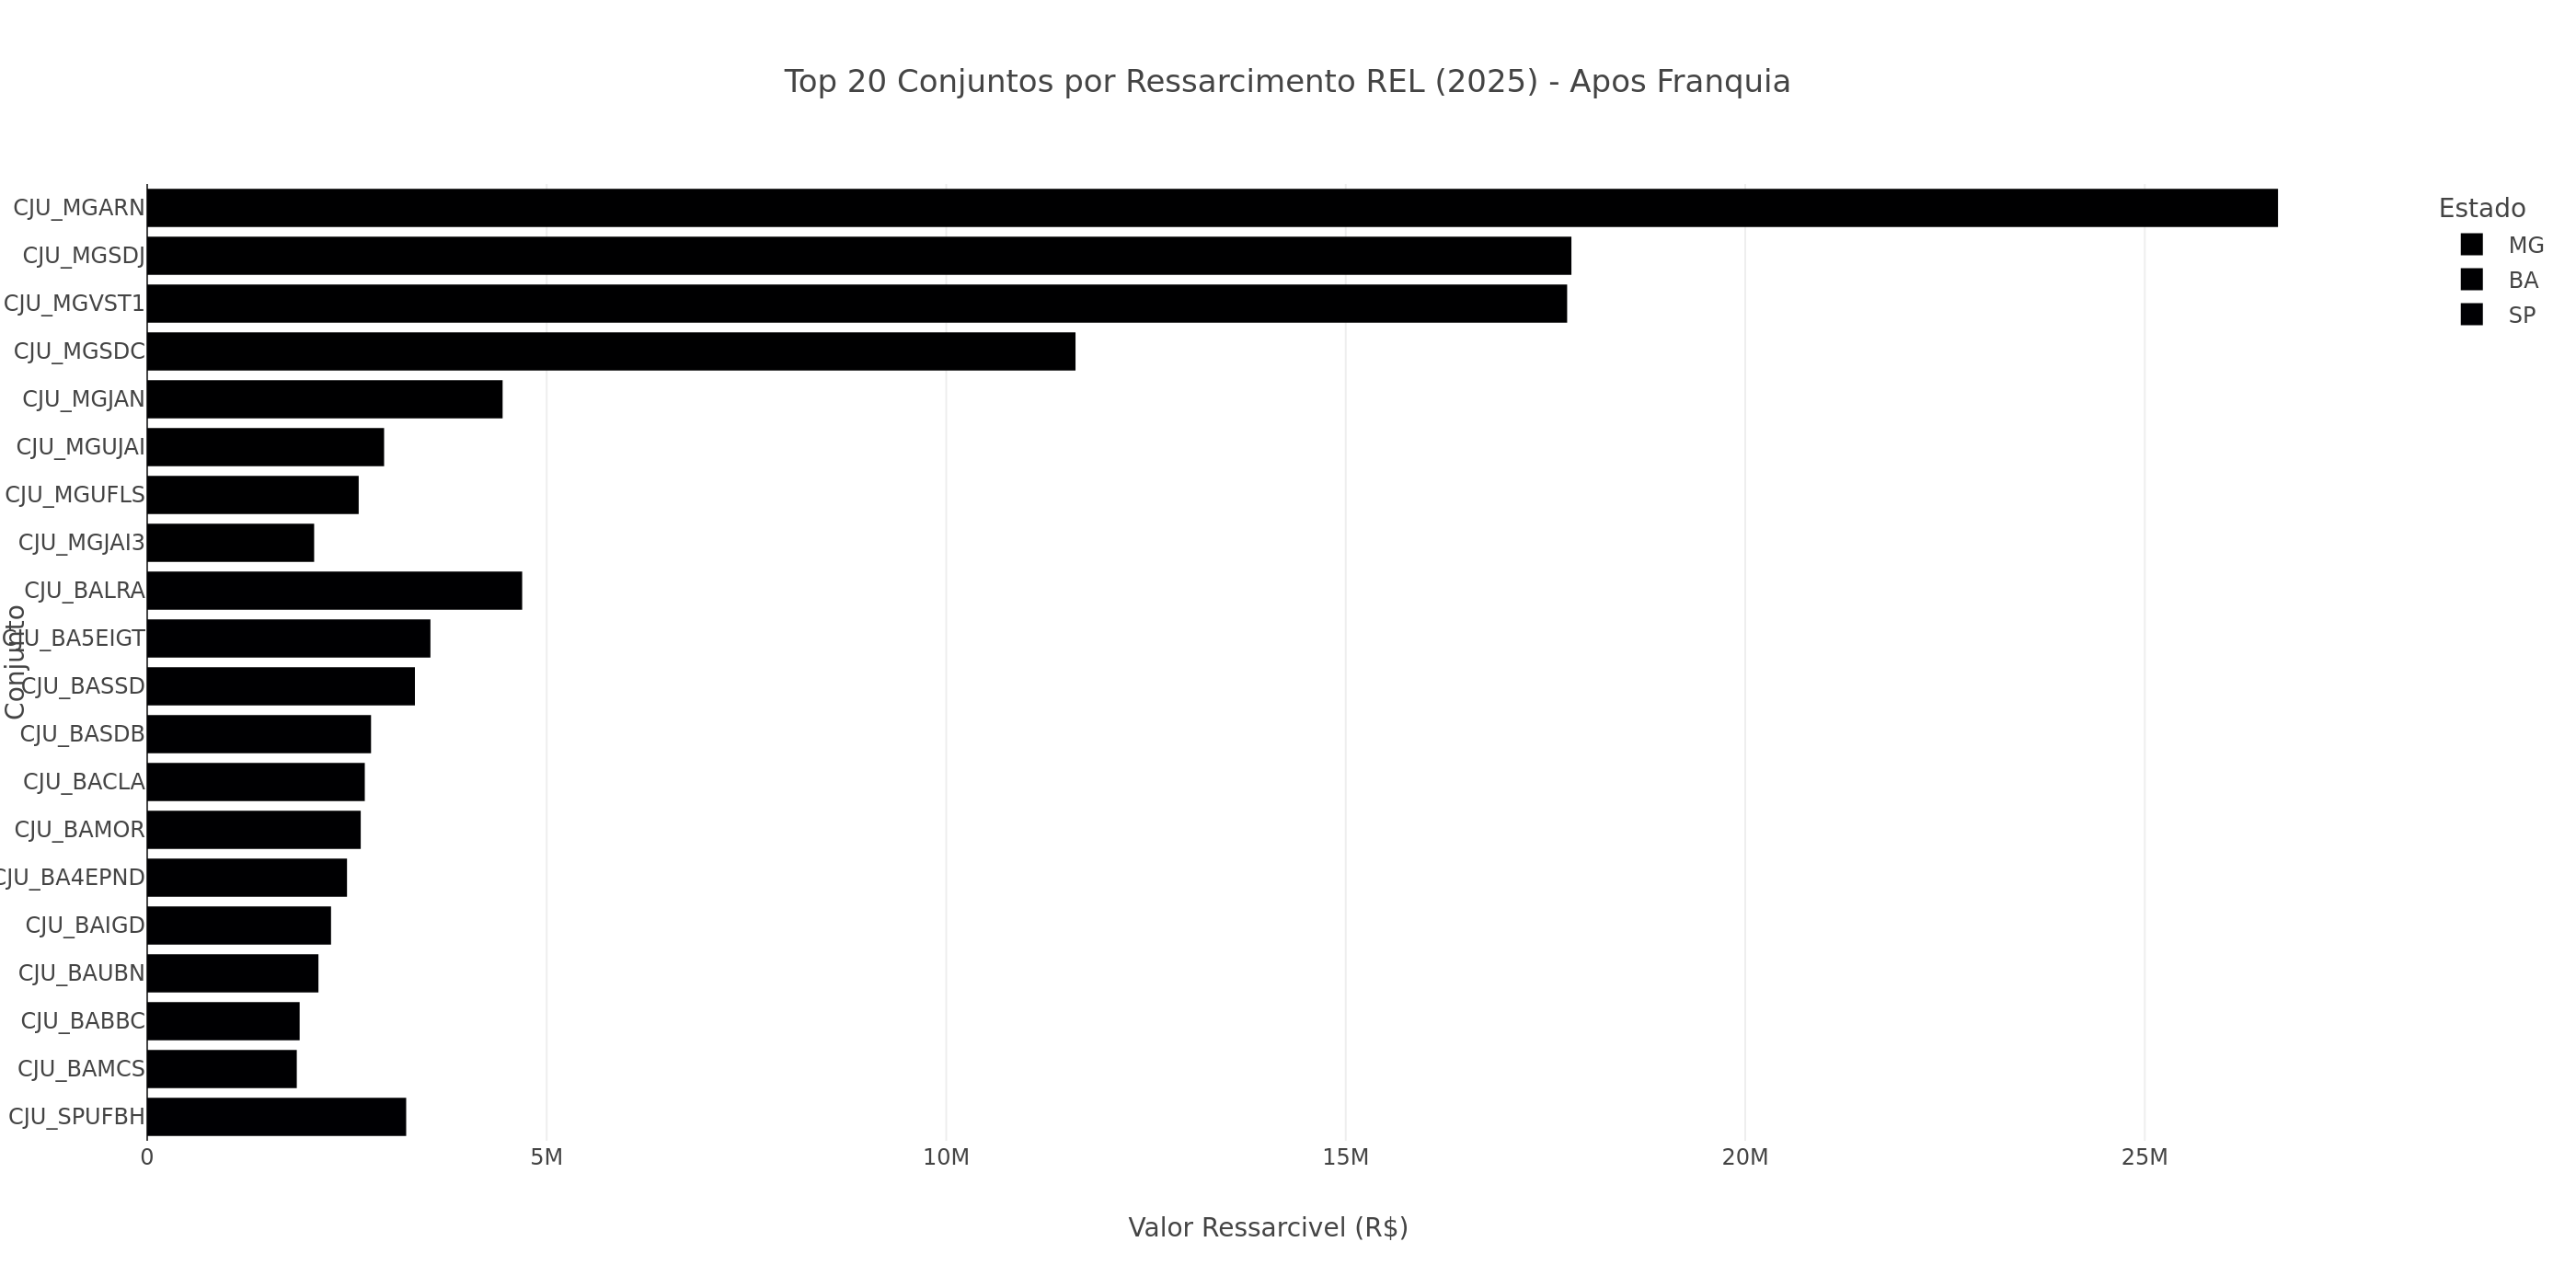
Radialization and Janauba: When One Piece of Equipment Costs R$115M
A single piece of equipment offline since Oct/2025 causes 471 GWh in the NE. 4,162 GWh from one substation.
Technical
11
affected states
BA, MG, RN: 3 Fronts, 3 Logics
NE saturating, BA accelerating, MG emerging. 11 states, 3 incompatible dynamics.